This post describes how to use Open vSwitch and sFlow collector for monitoring network traffic and for building VM-to-VM traffic matrix. The instruction aims at traffic monitoring for VMs connected to a software Bridge and is described based on an OpenStack setup environment (VMs are connected to br-int on each compute host).
Configuration Steps
1. On each physical host that the software bridge (Open vSwitch) is installed, define the following environment variables in the shell:
COLLECTOR_IP=192.168.99.1
COLLECTOR_PORT=6343
AGENT_IP=eno1
HEADER_BYTES=128
SAMPLING_N=64
POLLING_SECS=10
COLLECTOR_IP is the IP address of the host which is responsible for collecting monitoring data and sFlow-RT is installed. Port 6343 (COLLECTOR_PORT) is the default port number for sFlow-RT. If you are using the sFlow collector other than sFlow-RT, the appropriate port for that particular collector should be set. Setting the AGENT_IP value to eno1 indicates that the sFlow agent sends traffic through the IP address associated with this network interface. The other values indicate settings regarding the number of bytes in the packet header and frequency of sampling that sFlow should perform.
2. Now you should create sFlow agent for the bridge using the following command:
$ ovs-vsctl -- --id=@sflow create sflow agent=${AGENT_IP} target="${COLLECTOR_IP}\:${COLLECTOR_PORT}" header=${HEADER_BYTES} sampling=${SAMPLING_N} polling=${POLLING_SECS} -- set bridge br-int sflow=@sflow
Note down the UUID of the sFlow agent returned by this command; this value is necessary to remove the sFlow configuration. You can also see the list of sFlow agents using the following command:
$ ovs-vsctl list sflow
To remove sFlow agent configuration from a bridge, in our case br-int, run the following command
$ ovs-vsctl remove bridge br-int sflow <UUID>
where UUID is the id of the sFlow agent returned in the earlier configuration.
3. Now you should download and install sFlow-RT as an engine for collecting stream from sFlow Agents embedded in the software switch. sFlow-RT converts monitoring streams into metrics accessible through the REST APIs. To download, install and run sFlow-RT use the following command on the collector host (COLLECTOR_IP).
wget http://www.inmon.com/products/sFlow-RT/sflow-rt.tar.gz
tar -xvzf sflow-rt.tar.gz
cd sflow-rt
./start.sh
For more info on sFlow-RT installation click here.
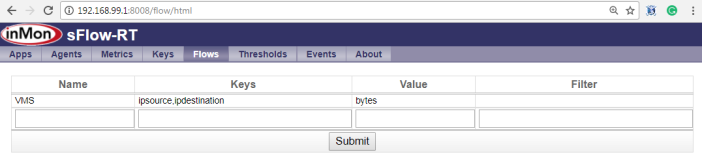
4. Now use a web browser to connect to http://192.168.99.1:8008 to interact with the REST API. You can define flows using the flows tab to match packets or transactions that share common attributes and compute rate information. For example, the following flow defines a flow called VMS that captures the source and destination IP addresses of VMs connected to the bridge and calculates bytes per second for each flow:
The following Python code defines the same flow using the REST API:
#!/usr/bin/env python
import requests
import json

flow = {'keys':'ipsource,ipdestination','value':'bytes','log':True}
requests.put('http://192.168.99.1:8008/flow/VMS/json',data=json.dumps(flow))
To get your defined flow now you can use the following REST API:
requests.get('http://192.168.99.1:8008/activeflows/ALL/VMS/json')
Please leave your feedback and question on this article.
In case you found any bugs, please leave comments.

Hello, I’ve already install sflow-rt but I did something and get it wrong. How can I remove the sflowrt exist? because I wanna reinstall sflow-rt. Thanks.
LikeLike
I am not sure, I have never done this!!!
LikeLike
How about this, when I run ./sflow-rt/start.sh
showing —> SEVERE: cannot open sFlow port 6343
do you know what’s problem is it?
LikeLike